Appearance
Dashboard Overview
This section provides an overview of the FluentCart Admin Dashboard, which is your control center for managing your e-commerce store.
INFO
For information on what your customers see when they log into their accounts, please refer to our Customer Dashboard Overview documentation.
The FluentCart Dashboard is the first screen you see when you log into your WordPress admin area and navigate to FluentCart. It provides a quick, at-a-glance overview of your store's performance and recent activities, helping you stay informed about your business operations.
Quick Access Controls (Top Right)
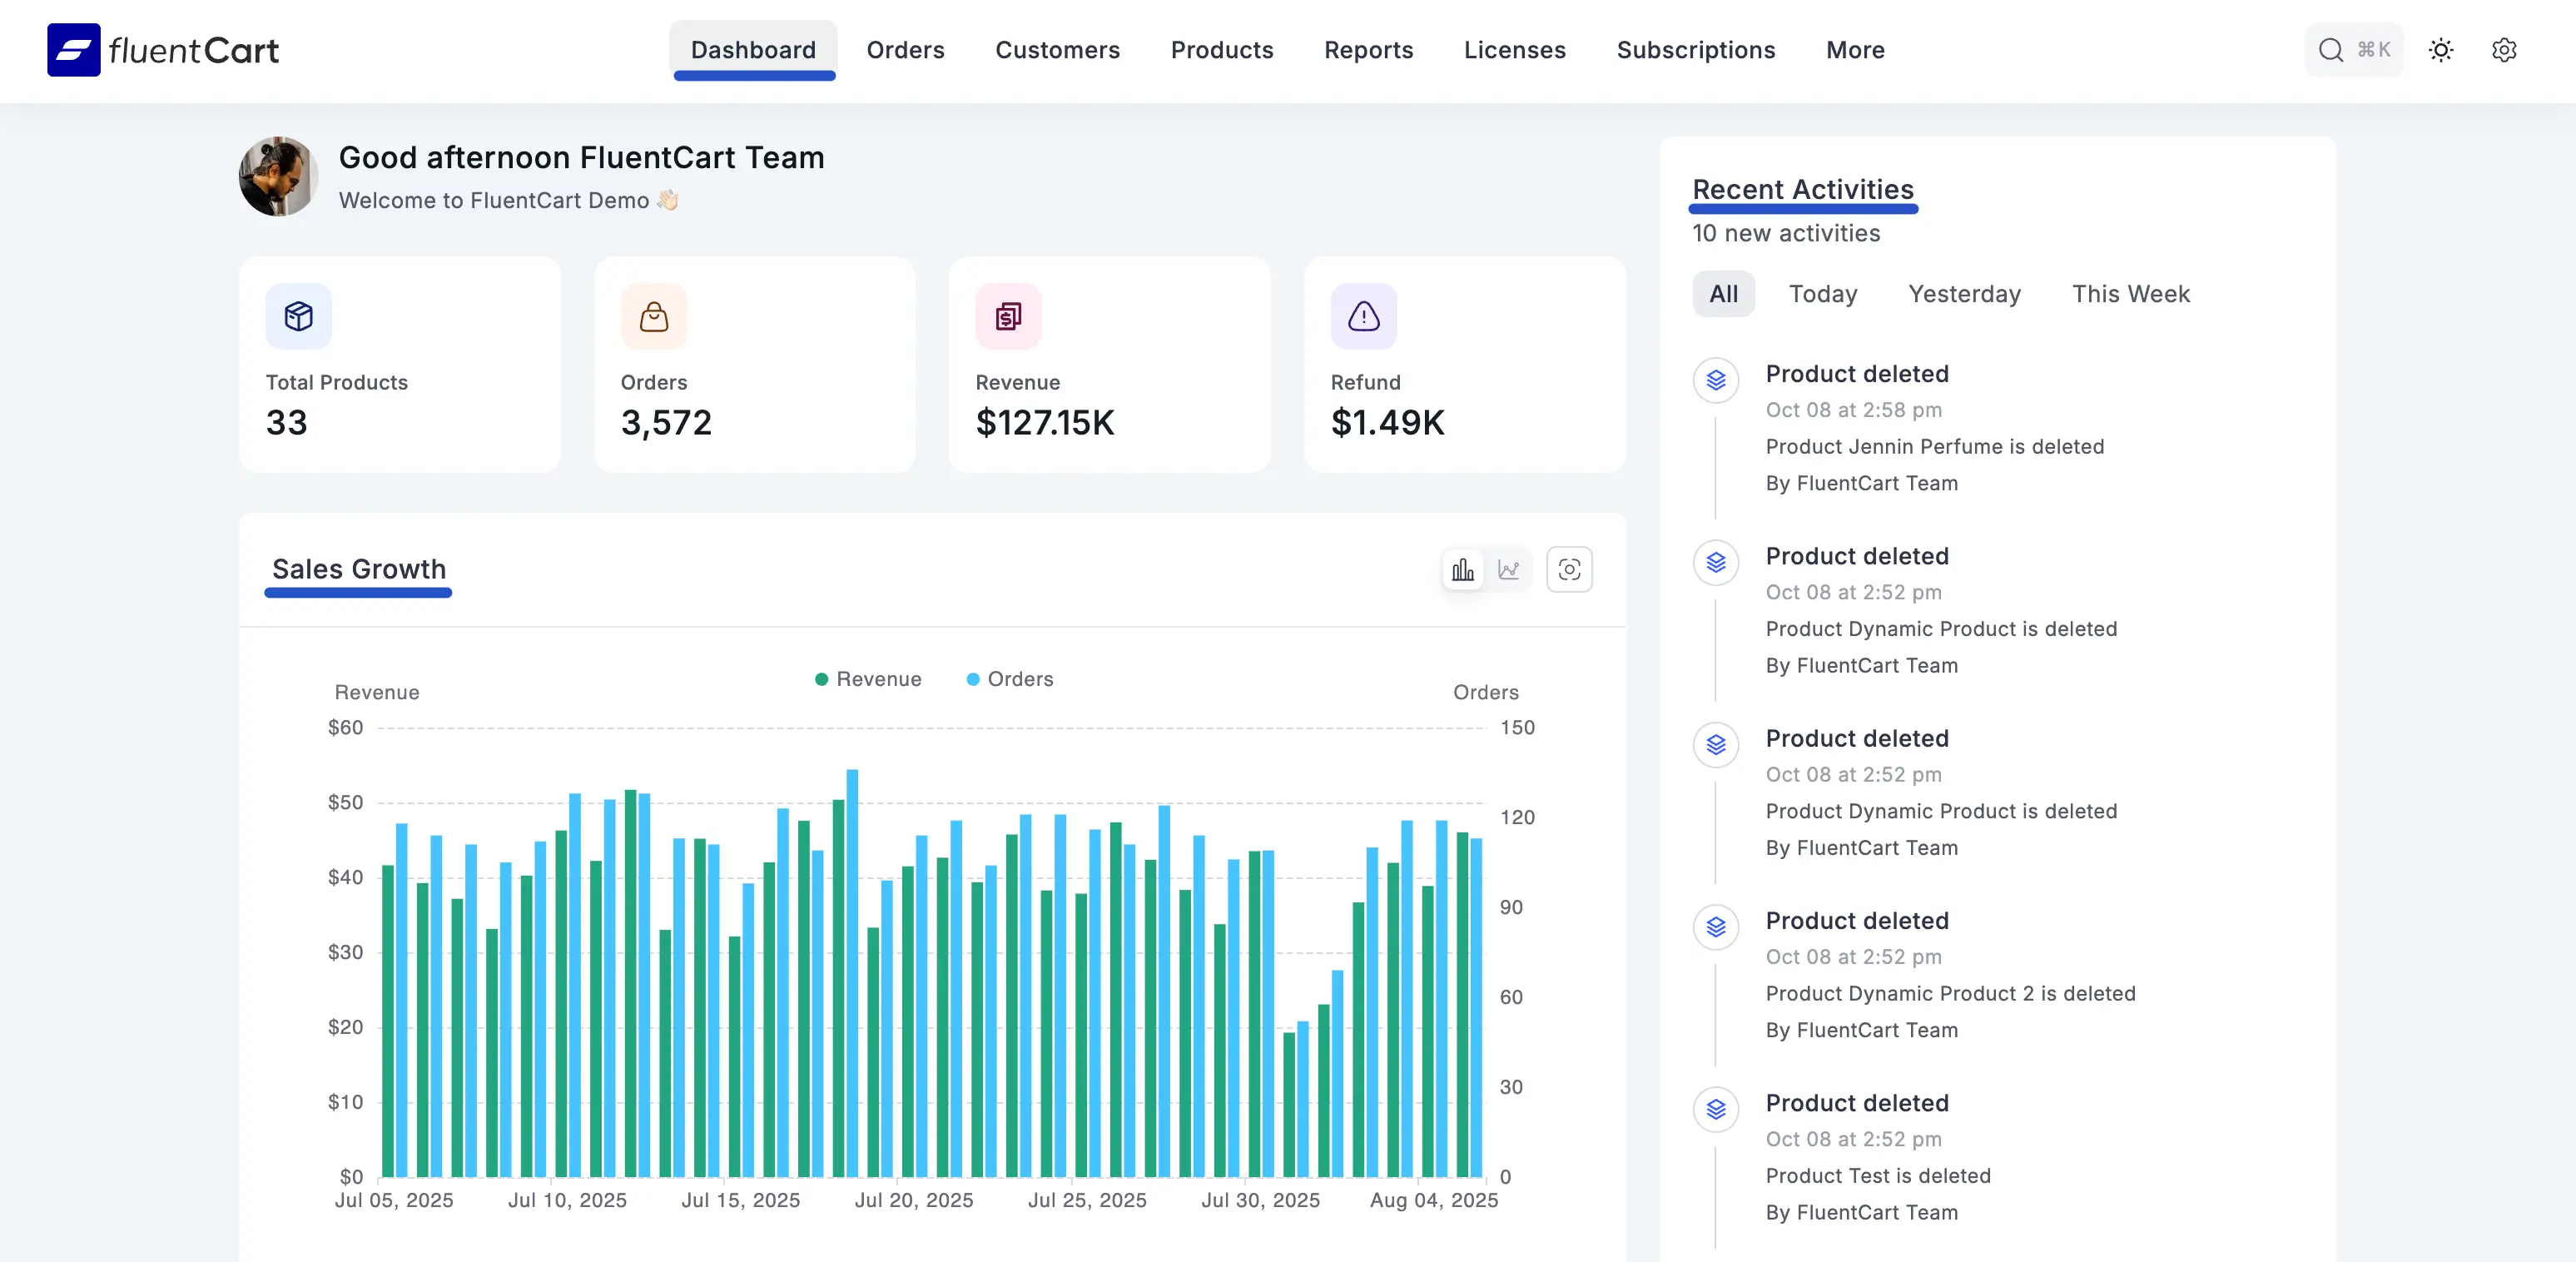
In the top-right corner of the FluentCart dashboard, you’ll find three helpful shortcuts:
Search (⌘K / Ctrl+K)
When someone clicks on the search panel, a popup will appear allowing them to search for products, orders, customers, or settings across FluentCart.Theme Toggle
Switch between Light, Dark, or System mode to match your preference.Settings Shortcut
Click the gear icon to go directly to FluentCart’s settings page for configuring store preferences, payments, emails, and more.
Key Dashboard Sections
The dashboard is designed to give you instant insights into your store's health.
1. Welcome & Quick Actions
At the top of the main dashboard area, you'll find a welcome message and quick action buttons.
- Add Product Button: A quick-access button to create a new product, allowing you to quickly expand your inventory.
2. Onboarding Checklist
On the right side of the FluentCart dashboard, you’ll see the Onboarding Checklist. This helps you quickly set up your store by walking through the essential first steps.
The checklist includes:
Add Details to Store
Enter your store name, address, and basic configuration in the settings panel.Add Your First Product
Create a product using the Products → Add New option to make your first item available for sale.Setup Pages
Generate key pages like Checkout, Cart, and Account in the settigns.Add Payments
Configure Stripe, PayPal, or other payment gateways so you can start accepting payments.
INFO
As you complete each step, FluentCart will mark it off automatically. This guide disappears once your setup is complete.
3. Store Key Metrics
This section of the dashboard provides a simple, at-a-glance overview of your store's most important performance indicators. It's designed to give you a quick snapshot of your business health every time you log in.
- Total Products: The total number of products currently in your store, including both published and draft items.
- Orders: The total number of orders your store has received.
- Revenue: The total revenue your store has generated from all sales.
- Refund: The total monetary value of all refunds that have been processed.
3. Sales Growth Chart
This chart provides a clear, visual representation of your store's performance over time, helping you to spot trends, track growth, and understand your sales patterns.
By default, the chart displays two key metrics:
- Revenue: The total monetary value of sales for each day.
- Orders: The total number of orders received each day.
You can hover your mouse over any point on the chart to see a detailed breakdown of the exact Revenue and Order count for that specific day. This makes it easy to analyze your performance and see how your sales are progressing.
5. Recent Activities
This log shows a list of the newest important things that happened in your store, such as order updates, payments, and refunds. It serves as a quick audit trail for recent operations.
- Example Activities: Order Created, Payment Paid, Order Status Updated, Order Refunded, Shipping Status Updated, License Upgrade.

6. Recent Orders
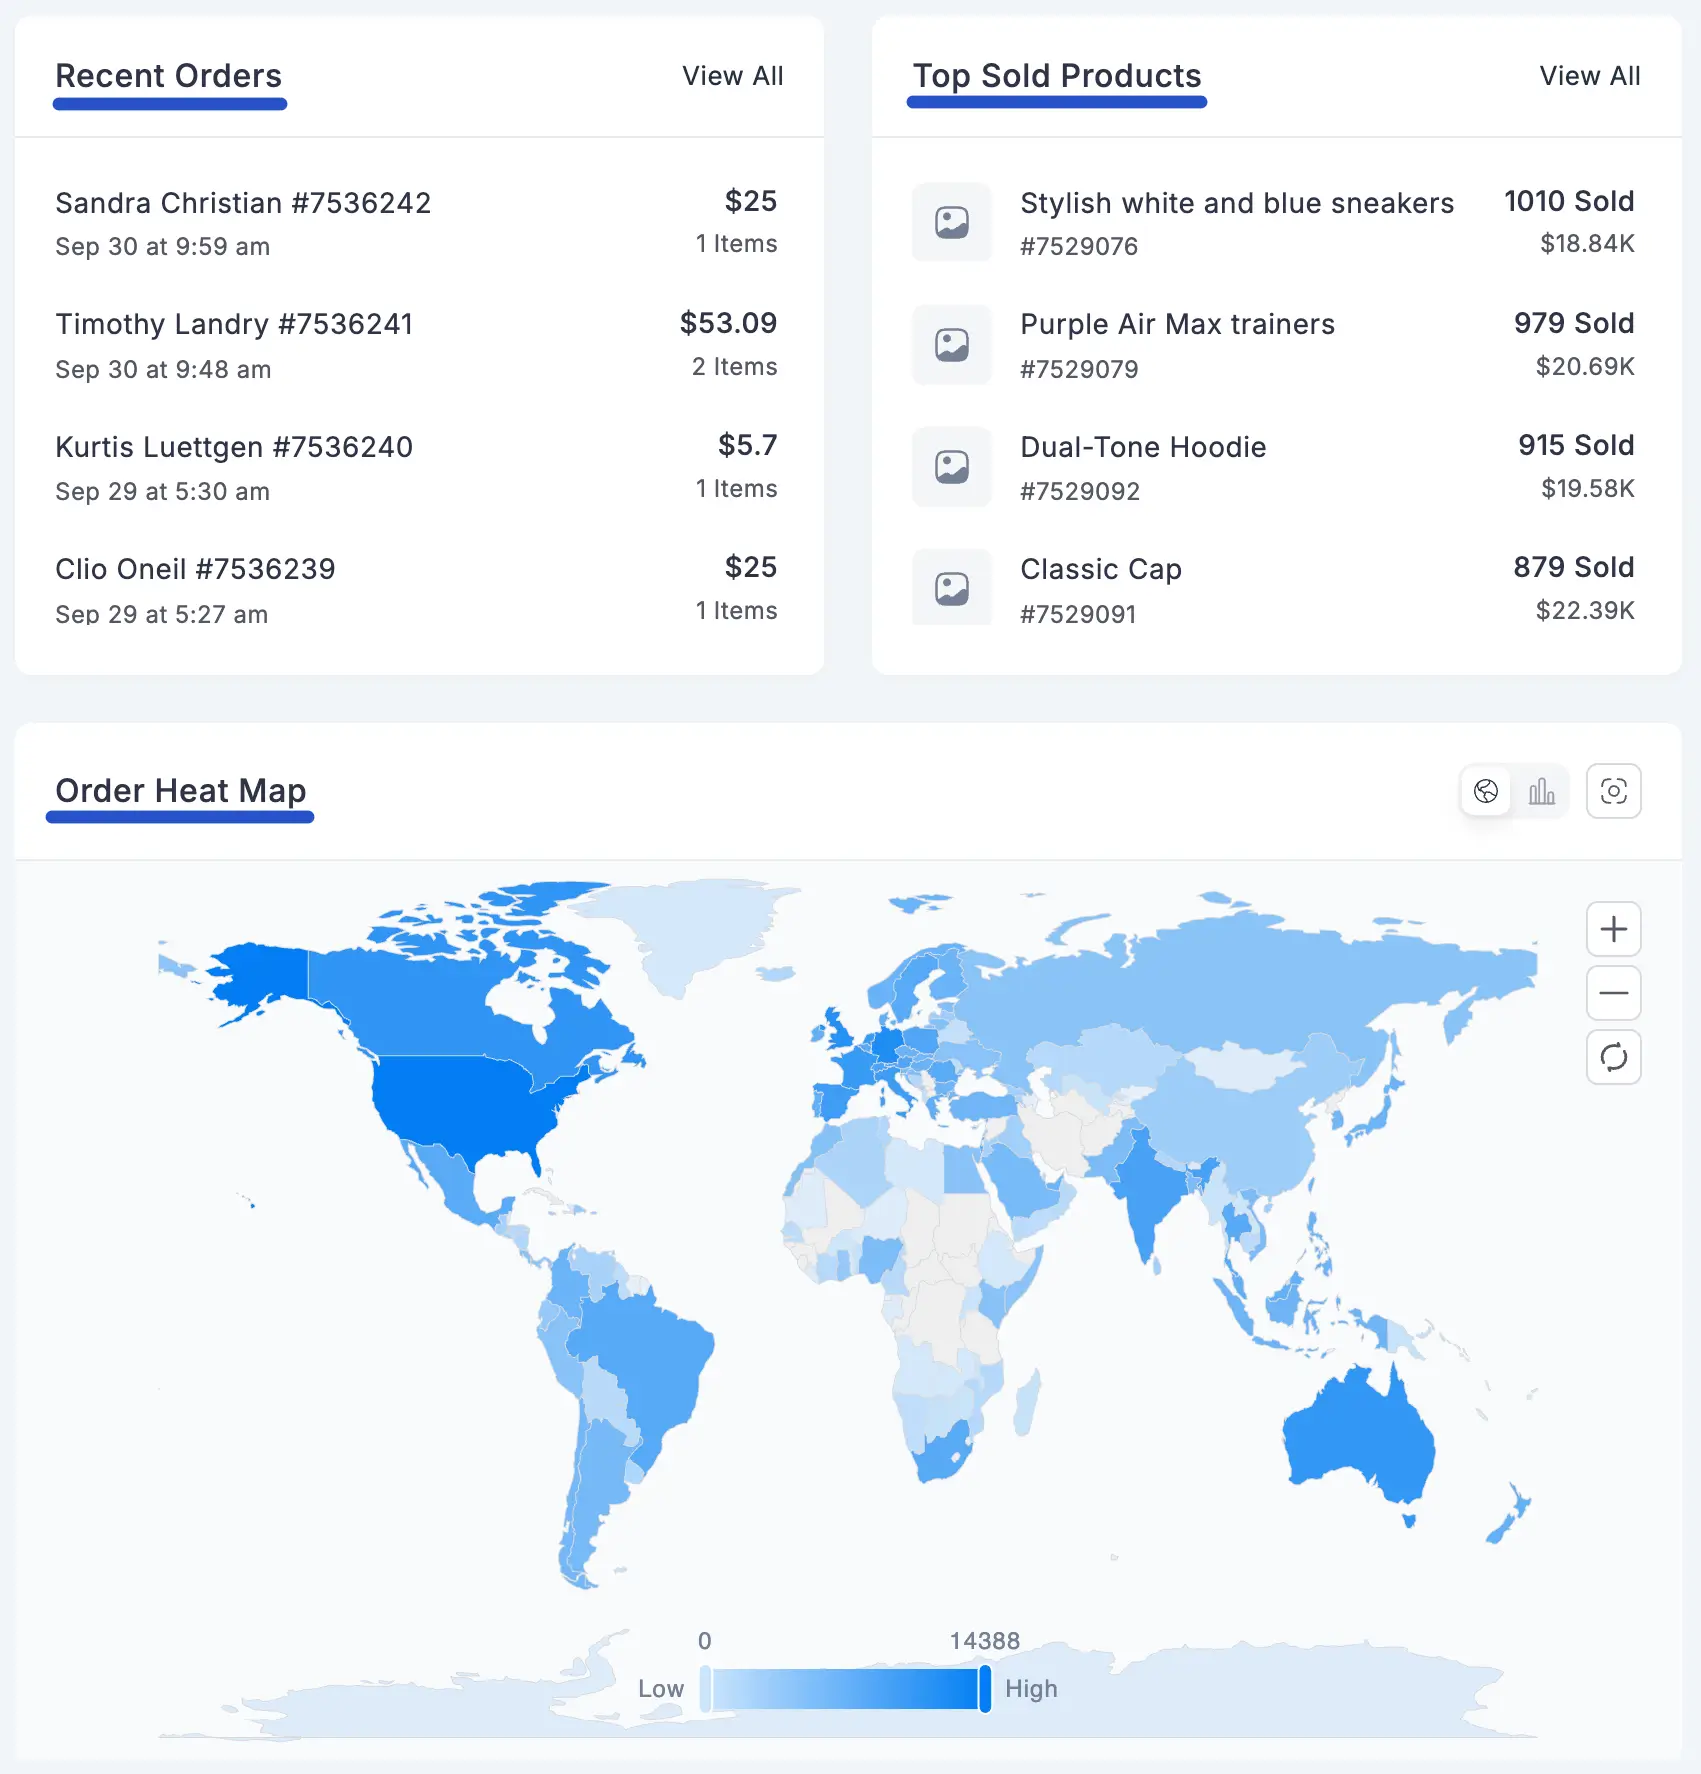
A snapshot of your most recent customer orders, allowing for quick review.
- Displays the Order ID, Creation Date, Customer Name, Number of Items, and Total Amount for each order.
- Includes a View All link to navigate to the full Orders Management screen for detailed management.
7. Top Sold Products
This widget highlights your current best-sellers, helping you to instantly see which products are most popular with your customers. It's a valuable tool for understanding product trends and making decisions about inventory and marketing.
- Click the View All link to navigate to the Products section for more details of your products.

8. Order Heat Map
A geographical visualization that likely shows areas with high order volume, giving you insights into your customer distribution.
